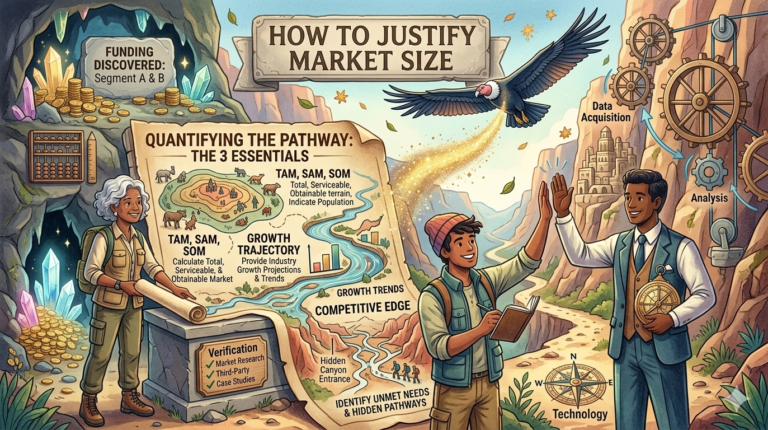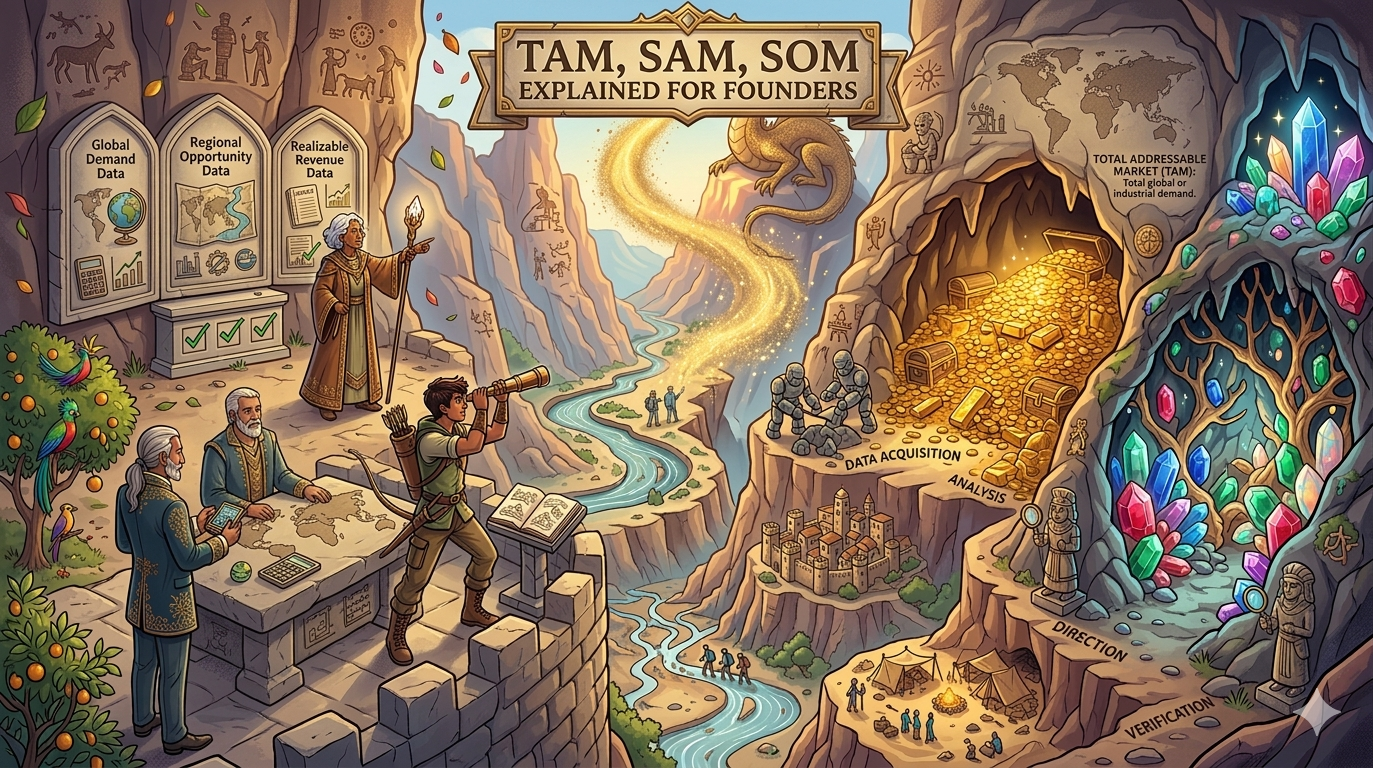
TAM, SAM, SOM Explained for Founders
You spend weeks building your startup pitch deck.
You refine the story. Polish the design. Practice your delivery.
Then an investor asks one simple question:
“What’s your TAM?”
Suddenly your brain freezes.
You vaguely remember something about TAM, SAM, and SOM, but now you’re second-guessing everything. Is your number too big? Too small? Will they think you don’t understand your market?
If you’ve felt that panic — you’re not alone.
Almost every early-stage founder struggles with market sizing. Not because the idea is difficult, but because it’s often explained poorly.
Here’s the truth:
Investors don’t ask about TAM to trap you.
They ask because they want a fast answer to one key question:
“Can this company become big enough to justify venture investment?”
Venture capital works on big outcomes. If a VC invests $3M–$10M into your startup, they typically need the potential for 10x+ returns. That means your company must realistically be able to reach hundreds of millions or billions in value.
Market size is simply the shortcut investors use to estimate that possibility.
The good news?
You don’t need complicated financial models.
By the end of this article, you’ll have a simple mental model that lets you explain TAM, SAM, and SOM in under 60 seconds — confidently.
The One-Sentence Version to Memorize
Let’s start with the simplest explanation possible.
TAM = the total market if everything went perfectly.
SAM = the portion of that market your product can actually serve.
SOM = the portion you can realistically capture in the near term.
That’s it.
Three layers of realism.
Think of it like ride-sharing in a city.
Imagine you’re launching a ride-sharing startup.
TAM
All ride-sharing revenue globally.
SAM
Ride-sharing revenue in the countries where you operate.
SOM
The percentage of that market you can realistically capture in the first few years.
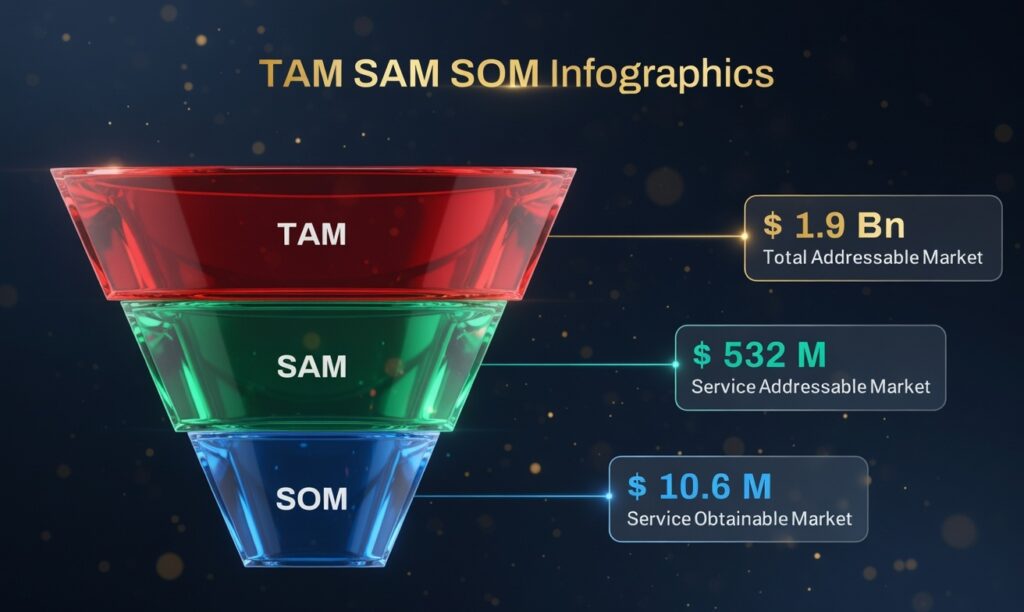
Visually, investors usually imagine this as a funnel:
TAM (Entire Market)

   ↓

SAM (Your Addressable Segment)

   ↓

SOM (Your Realistic Share)
Or a dartboard:
- Outer ring → TAM
- Middle ring → SAM
- Bullseye → SOM
The framework simply moves from theoretical → practical → realistic.
Once you understand that progression, market sizing becomes much easier.
TAM
Your Total Addressable Market (TAM) is the maximum possible revenue opportunity if your company captured the entire market.
But here’s where founders often go wrong.
They treat TAM like a dream scenario.
Instead, investors expect TAM to be large but believable.
Two ways founders calculate TAM wrong
Mistake #1: Copying a giant industry number
Example:
“The global fintech market is $5 trillion.”
That number might be real — but your startup doesn’t serve that entire market.
Investors see this immediately.
Mistake #2: Assuming everyone is a customer
Example:
“Everyone who owns a smartphone could use our app.”
Technically possible.
Practically meaningless.
The better way: Bottom-up TAM
The most credible method starts from actual customer numbers.
Formula:
TAM = Number of Potential Customers × Average Revenue Per CustomerExample:
Startup: AI bookkeeping tool for freelancers
Potential freelancers globally: 100 million
Average yearly subscription: $120
TAM = 100M × $120

TAM = $12B
That’s large and believable.
Many investors encourage this bottom-up approach rather than purely industry-report numbers.
Helpful guide:
https://pear.vc/market-sizing-guide
Another strong explanation:
https://www.antler.co/blog/tam-sam-som
2025–2026 reality check
Investors are currently especially interested in large markets in areas like:
- AI productivity
- Climate technology
- Developer tools
- Healthcare infrastructure
- Fintech infrastructure
But even in hot sectors, credible market sizing still matters.
SAM
If TAM is the theoretical maximum, SAM (Serviceable Addressable Market) is where reality begins.
SAM represents:
The portion of the market your product can realistically serve.
This is where founders often overestimate without realizing it.
Why?
Because shrinking the number feels like weakening the pitch.
In reality, investors prefer honest SAM calculations.
Filters that usually reduce TAM into SAM
Common filters include:
• Geography
• Customer segment
• Technology adoption
• Language barriers
• Regulatory limits
• Distribution channels
Example
Startup: AI bookkeeping tool
TAM calculation earlier:
100M freelancers globally

$120/year

TAM = $12B
Now apply realistic filters.
Only freelancers in:
- English-speaking markets
- Using online accounting
- Comfortable with SaaS tools
Potential customers now:
20 million freelancers
SAM = 20M × $120

SAM = $2.4B
Still huge — but now much more believable.
A helpful investor perspective on realistic market filtering here.
The gut-check question founders should ask
Ask yourself:
“If we launched tomorrow, who could actually buy this product?”
That answer defines your SAM.
SOM
Here’s a surprising truth.
Investors often care most about SOM.
Your Serviceable Obtainable Market represents:
The portion of the market you can realistically capture in the next few years.
This number shows ambition balanced with realism.
Example: Inflated SOM
Founder pitch:
SAM = $2B

We will capture 25% in 3 years
Investors immediately think:
“Impossible.”
Example: Credible SOM
Instead:
SAM = $2B

Initial target = 2% market share

SOM = $40M opportunity
Now it sounds much more grounded.
Investors know startups grow gradually.
A practical breakdown of SOM thinking can be found here.
Example scenario
Startup: AI interview preparation platform
Potential market:
- 10M founders globally
- $200 yearly subscription
TAM = $2BTarget segment:
- English-speaking startup founders
- Early-stage founders actively raising funding
SAM = 2M founders

SAM = $400M
Realistic capture in 3–5 years:
2% of SAM

SOM = $8M
This narrative is credible and compelling.
Bottom-Up vs Top-Down
There are two main ways to calculate market size.
Top-down approach
Start with a large industry number and narrow it.
Example:
Global e-commerce market = $6T

Online store tools = 2%

TAM = $120B
Pros:
• Fast
• Easy to find data
Cons:
• Often too vague
• Feels inflated to investors
Bottom-up approach (preferred)
Start from actual customers.
Example:
500K Shopify stores

$40/month SaaS tool

TAM = $240M
Pros:
• Concrete
• Credible
• Data-driven
Cons:
• Requires research
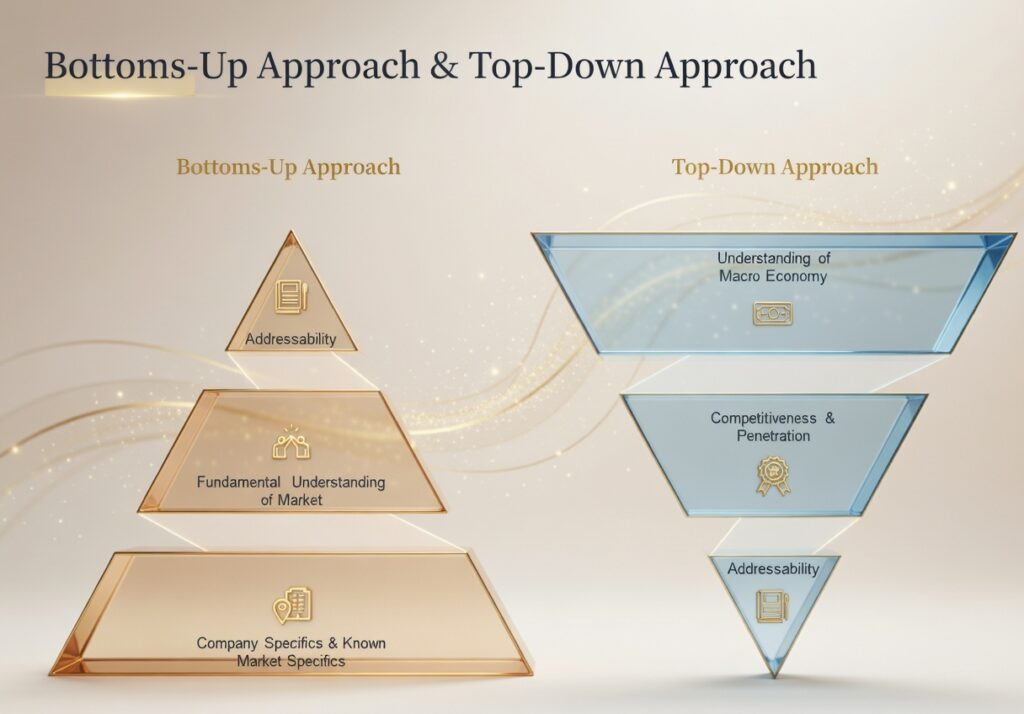
Best approach: Hybrid
Use bottom-up first, then top-down as validation.
How to Talk About TAM/SAM/SOM Without Sounding Like a Robot
Numbers alone don’t convince investors.
The story around them does.
Here’s a simple explanation you can memorize.
Example 45-second explanation
“The global market for freelance accounting tools is roughly $12B.
Our product specifically targets English-speaking freelancers using SaaS bookkeeping tools, which narrows the opportunity to about $2.4B.
Our initial goal is capturing about 2% of that segment over the next five years, which represents roughly a $50M opportunity.”
Clear. Simple. Logical.
Conclusion
Let’s simplify everything you just learned.
The mental model
Remember three steps:
- TAM → the biggest believable market
- SAM → the portion you can serve
- SOM → the portion you can realistically capture
That’s the entire framework.
The founder truth
Your market size won’t determine your success alone.
Great companies sometimes start in markets that look small — then expand dramatically.
But explaining your market clearly shows investors you think strategically.
Ready to Ace Your Next Funding Pitch?
Join thousands of founders who have improved their pitch skills and secured funding with our automated interview simulator.