
How to Justify Market Size
Investors don’t fund ideas — they fund big, believable opportunities.
A weak or unsubstantiated market size claim is one of the fastest ways to lose credibility in a pitch meeting.
Many founders make the same mistake: they throw out a giant number like:
“The global market is worth $500 billion.”
That might sound impressive, but experienced investors immediately ask:
- How did you calculate that?
- How much of that market can you actually serve?
- How much could this company realistically capture?
If you can’t answer those questions clearly, the number means nothing.
Justifying market size means proving, not just claiming that your startup has enough revenue potential to generate venture-scale returns.
To do that, founders usually explain three related concepts:
- TAM (Total Addressable Market): The total demand for your product if you captured 100% of the market.
- SAM (Serviceable Addressable Market): The portion of TAM you can realistically serve with your product today.
- SOM (Serviceable Obtainable Market): The portion of SAM you could realistically capture in the near term.

Investors don’t expect perfect precision. But they do expect clear logic, realistic assumptions, and credible data sources.
If you want to see how major investors think about this, these resources are excellent starting points:
- Sequoia Capital’s guide on building a business plan.
- Y Combinator’s guide to pitching startups,
The goal of this article is simple:
Help you build market size numbers that survive investor scrutiny.
Why Justifying Market Size Matters (Investor Perspective)
Venture capital works on a simple math model.
Investors expect that most startups will fail. To make the portfolio work, a few companies must generate massive returns.
That means investors usually look for companies that could reach very large markets.
Often, that means:
A potential TAM of $1B or more.
Not because every startup must reach that scale, but because the possibility needs to exist.
Red Flags Investors See Immediately
Experienced investors can spot weak market sizing quickly.
Common warning signs include:
- Huge top-down numbers with no explanation
- No distinction between TAM, SAM, and SOM
- No sources for data
- Numbers that don’t connect to pricing or customers
For example:
“The global fitness market is $200B, so if we capture 1% we make $2B.”
This is a classic beginner mistake.
It doesn’t show:
- Who the customers are
- Why they would buy
- Whether your product fits the entire market
What Good Market Justification Shows
A strong market sizing analysis tells investors three things:
- You understand your customers deeply
- You understand how your business will make money
- You are thinking realistically about growth
This resource link explains how investors interpret TAM/SAM/SOM:
The excellent guide from Underscore VC focuses specifically on bottom-up market sizing, which investors often prefer:
In short:
Market sizing isn’t just math rather, it’s evidence of strategic thinking.
The Two Main Ways to Calculate Market Size
There are two main ways founders calculate market size.
1. Top-Down Market Sizing
This starts with a large industry report and then narrows it.
Example:
- Global e-commerce market: $5 trillion
- Retail software market: $50 billion
- Your segment: $2 billion
These numbers often come from sources like:
- Statista
- Gartner
- McKinsey
- IBISWorld
The advantage:
- Quick to calculate
- Easy to visualise
The disadvantage:
It often exaggerates the real opportunity.
Early-stage investors know that just because a market exists doesn’t mean your startup can access it.
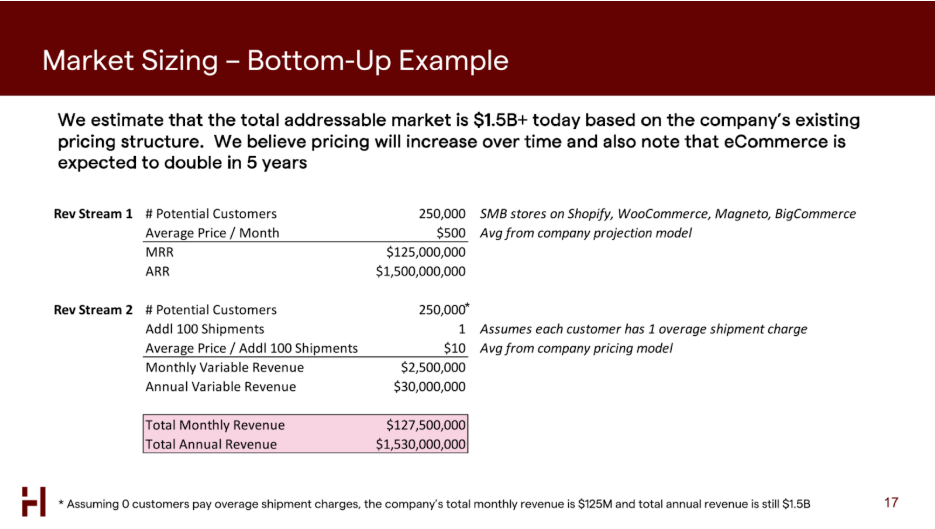
2. Bottom-Up Market Sizing
This method starts with actual customers and pricing.
Formula:
Total Customers × Average Revenue Per Customer = Market SizeExample:
A SaaS platform for logistics companies.
- 40,000 logistics firms globally
- $120/month subscription
TAM:
40,000 × $120 × 12 months

= $57.6M annual market
But if the product expands across segments, the TAM grows.
This method is much more credible because it reflects how the business actually earns revenue.
3. Hybrid Approach
The strongest pitch decks often use both:
- Bottom-up calculation (primary)
- Top-down data (validation)
Investors prefer bottom-up logic first.
These guides explain both approaches well:
Antler market sizing guide.
Pear VC market sizing guide:
Step-by-Step: How to Build a Credible Bottom-Up TAM
Let’s walk through the process founders should follow.
Step 1: Define Your Ideal Customer Profile (ICP)
Start by clearly identifying your target customer.
Example:
Startup idea: AI accounting tool for freelance creators
Ideal customers:
- Freelancers earning $30K+ annually
- Operating in US/UK
- Managing taxes independently
Your market should be defined by customer type, not industry buzzwords.
Step 2: Estimate Total Potential Customers
Next, estimate how many potential customers exist.
Possible sources:
- Government statistics
- Industry reports
- Platform data (e.g., Shopify store counts)
- Surveys
Example:
Freelance creators in US and UK:
- 7 million creators
Step 3: Estimate Revenue Per Customer (ARPU)
Now estimate what each customer might pay.
Example:
SaaS tax management tool
Pricing:
- $20 per month
Annual value:
$20 × 12 = $240 per customerStep 4: Calculate TAM
Now multiply.
7M customers × $240

= $1.68B TAM
Now the number has logic behind it.
Example: SaaS Tool for E-commerce Stores
Imagine a startup building inventory optimization software for mid-market e-commerce companies.
Step 1: Target segment
- Shopify stores with revenue > $1M
Step 2: Market size
- ~200,000 stores globally
Step 3: Price
- $100/month subscription
Step 4: TAM
200,000 × $1,200 per year

= $240M TAM
Now the number is defensible.
The guide in this link walks through similar examples.
Another useful resource is one from this link.
SAM and SOM (The Realistic Layers Investors Love)
Once TAM is defined, the next step is narrowing it.
This is where many founders build credibility.
SAM: Serviceable Addressable Market
SAM is the portion of TAM that your product can actually serve today.
Filters often include:
- Geography
- Customer type
- Product limitations
Example:
From previous e-commerce software example:
TAM:
200,000 stores globallyBut if your startup initially focuses on North America:
SAM:
60,000 storesSOM: Serviceable Obtainable Market
SOM represents realistic market capture within 3–5 years.
This depends on:
- Competition
- Go-to-market strategy
- Funding
- Sales capacity
Example:
If the startup captures 3% of SAM:
60,000 × 3%

= 1,800 customers
At $1,200 per year:
$2.16M revenue
This shows a credible path to growth.
Investors appreciate founders who balance:
- Ambition
- Realism
Good explanation of presenting TAM/SAM/SOM can be found using this link.
How to Source Data and Back Up Your Numbers
The most important rule of market sizing:
Always show your sources.
Even rough numbers become credible when backed by data.
Good Sources
Common data sources include:
- Statista
- IBISWorld
- Government statistics
- Company annual reports
- Industry associations
- Surveys
- Platform data (e.g., Shopify, Stripe)
For example:
If you’re building an e-commerce tool, you might estimate customers using:
- Shopify store statistics
- WooCommerce adoption data
Useful Tools
Founders often gather data using:
- Google searches
- Industry research reports
- Crunchbase
- PitchBook
- Public financial reports
Transparency is key.
You should:
- Add footnotes on slides
- Mention assumptions in your pitch
The resources in this link explain sourcing approaches well:
Avoid this common mistake:
“Everyone needs this product.”
Investors want specific, measurable demand.
Common Justification Mistakes
Here are some of the most common market sizing errors founders make.
1. Top-Down Only
Problem:
Using giant industry numbers without explaining customer counts.
Fix:
Add a bottom-up calculation.
2. Unrealistic SOM
Problem:
Claiming 20–30% market share quickly.
Fix:
That can work in rare cases but start with 1–5% realistic capture.
3. No Data Sources
Problem:
Numbers appear without explanation.
Fix:
Add sources or explain assumptions.
4. Ignoring Competition
Problem:
Assuming your startup can capture the whole market.
Fix:
Account for competitors in SOM estimates.
5. Static Markets
Problem:
Ignoring industry growth.
Fix:
Mention trends expanding the market.
6. Confusing TAM/SAM/SOM
Problem:
Numbers overlap or contradict.
Fix:
Show clear funnel structure.
7. Inflated Pricing Assumptions
Problem:
Using unrealistic ARPU estimates.
Fix:
Benchmark similar companies.
Presenting Justified Market Size in Your Pitch Deck
Market sizing should usually appear on one clean slide.
A typical layout includes a funnel or pyramid visual.
Example structure:
TAM → SAM → SOMExample narrative:
“Bottom-up, we estimate a $2.1B TAM based on 7 million creators paying $240 annually. Our initial product focuses on US and UK creators, representing a $700M SAM. Our goal is capturing 2–3% of that market in five years.”
Design Tips
Good market slides use:
- Visual funnels
- Simple charts
- Source citations
Avoid:
- Dense paragraphs
- Complicated spreadsheets
Here are examples of strong pitch decks:
https://slidebean.com/pitch-deck-examples
and
https://www.openvc.app/blog/market-slide
The goal is clarity.
Investors should understand your market opportunity within seconds.
Conclusion
Justifying market size isn’t about impressing investors with giant numbers.
It’s about building trust.
A strong market sizing explanation combines three things:
Bottom-up logic
Clear math based on customers and pricing.
Credible sources
Evidence supporting your assumptions.
Realistic expectations
Ambition balanced with practicality.
When founders do this well, investors gain confidence that the founder understands:
- Their customer
- Their business model
- Their growth potential
Your next step is simple.
Take your startup idea and:
- Define your ideal customer
- Estimate total customers
- Estimate realistic pricing
- Calculate bottom-up TAM
- Narrow to SAM and SOM
Then test the numbers with mentors or other founders.
Because great market justification does something powerful:
It turns investor skepticism into curiosity and curiosity into funding conversations.
Ready to Ace Your Next Funding Pitch?
Join thousands of founders who have improved their pitch skills and secured funding with our automated interview simulator.